Chart Y-Axis
Description of chart Y-Axis settings
|
||||
|
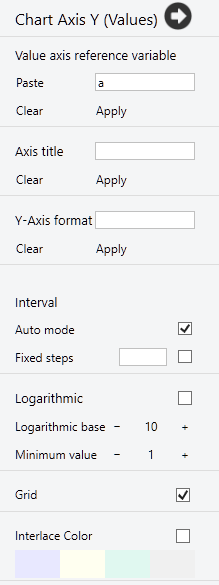
The Button "Y-Axis settings" shows a dialog window for input of the y-axes properties. |
||||
|
|
||||
Y-Axis Panel |
||||
ReferencePaste the selected variable as y-axis references to the chart. |
 |
|||
TitleThis text is displayed next to the axis. |
||||
Format
Result format, which is displayed in labels. |
||||
IntervalDefines the interval for the labels or grids. |
||||
Auto modeThe interval of the labels or grids is set automatically. |
||||
Fixed stepsSets the interval for the labels or grids. |
||||
LogatithmicEnabled a logarithmic scale for this axis. |
||||
Logarithmic baseSets the base of the logarithm for a logarithmic axis. |
||||
Minimum valueDetermines the minimum value for the axis. |
||||
GridDisplays the axis grid. |
||||
Interlace color
Defines the color, which is displayed in horizontal grids. |
||||
|
See also: Chart Box, Chart Legend, Chart Type, Chart X-Axes, Chart Options |
||||
Other graphics and design
| Charts | Displays results graphically |
| Chart types | Choose the chart type |
| Chart legend | Change the chart legend |
| Chart x-axis | Change chart x-axis settings |
| Chart y-axis | Change chart y-axis settings |
| Chart options | Change the chart options |
| Text | Insert text or a text file in a text box |
| Image | Insert images from clipboard or files |
| Slider | Insert a slider as a variable |
| Label | Insert label in chart oder image |
| Plot | Insert a plot box |
| Tables | Display of tables |
| Print the worksheet |
|
|