Line Function
Draw a line in a plot box
Description
The \(Line\) function draws a line between the specified x and y coordinates in a plot box.
The position can be specified with real x/y values or objects of class Point.
Syntax
Linie (x1,y1, x2, y2)
Linie (x1,y1, x2, y2, id)
Linie (x1,y1, x2, y2, id, options)
Linie (Point, Point)
Linie (Point, Point, id)
Linie (Point, Point, id, options)
Parameter variants
Line(Point a, Point b)
Draw a line between the points specified in the pointa a and b.
Line (x1, y1, x2, y2)
Draw a line between the specified X / Y coordinates.
Line (x1, y1, x2, y2, id)
If the worksheet contains multiple plot boxes, the number of the optional parameter id determines in which box the line will be drawn.
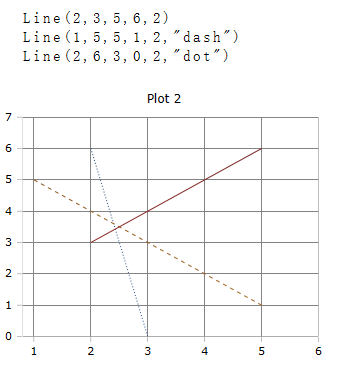
Line (x1, y1, x2, y2, "dash")
The Line Type can be changed to solid, dash, or dot (solid, dashed, or dotted).
Line (x1, y1, x2, y2, "title:Name")
Title: changes the text in the legend.
Line (x1, y1, x2, y2, "thickness:3")
Thickness: changes the width of the line (in the example: 3 pixels)
Line (x1, y1, x2, y2, "color:#rrggbb")
Color: # changes the color of the line The color is given in 6 hexadecimal numbers for red, green and blue.
Several optional parameters, separated by commas, can be specified.
Line(6,6,3,3,"dash","thickness:4","color:#ff0000")
Example
Generator Funktionen