PlotFiveN Function
Visualizes the five most important statistical values
Description
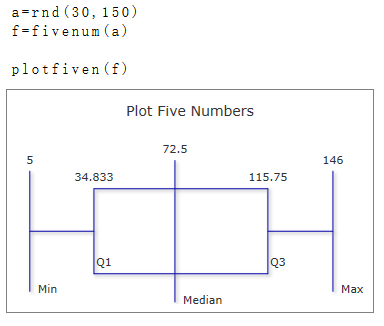
The function \(PlotFiveN\) creates a graphical summary of the five most important statistical values from a set of data. To display the graphic, a plot box must be opened.
The argument must be a list containing the five values. The list can be generated from the statistical data using the FiveNum function.
The following values are displayed: Minimum, First Quartile, Middle Value, Third Quartile, and Maximum Value.
Syntax
Plotfiven (n,)
Plotfiven (n, id)
Parameter
n
A list containing the five values to be displayed.
Optional Parameter
id
Id number of the plot box, if more than one box is open on the worksheet.
Beispiel
Generator Funktionen