Plot Function
Drawing curves and diagrams
Description
The \(Plot\) function creates a drawing based on the values of the specified x and y coordinates.
Syntax
Plot (y)
Plot (x, y)
Plot (y, id)
Plot (y, id, style)
Plot (y, id, style, type)
Plot (x, y, id, style, type)
Plot (re + im)
Parameter variants
Plot (y)
Draws the data points of the Y-axis on a continuous X-axis.
Plot (x, y)
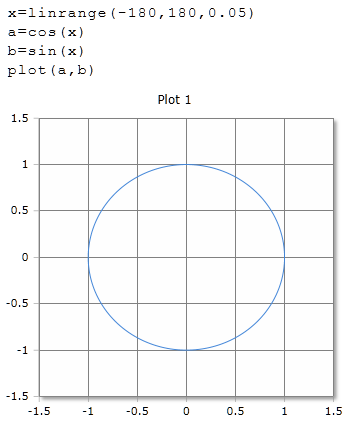
Draw the data points exactly at the specified X / Y position if the fields of X and Y are the same length.
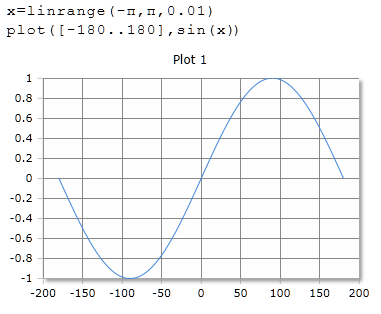
Plot ([-2, 2] , y)
Draws the data points of the Y-axis on a continuous X-axis. The X-axis is scaled from -2 to +2.
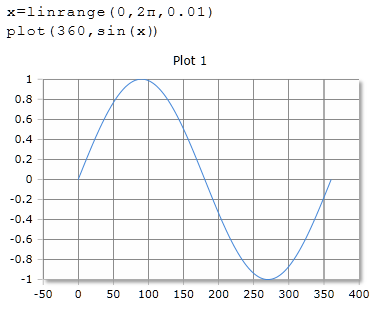
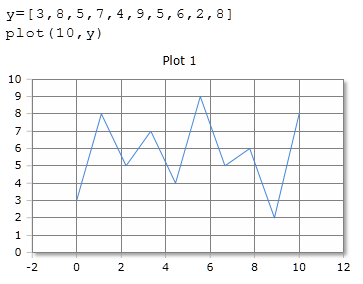
Plot (180 , y)
Draws the data points of the Y-axis on a continuous X-axis. The X-axis is scaled from 0 to 180
Plot (x, y, id)
If the worksheet contains multiple plot boxes, the number of the optional parameter id determines in which box the plot is displayed
Plot (x, y, "axes:-5, 5, 0, 50)
With Axes: the ranges of the X and Y scale are changed. You must specify 4 values in the following order for MinX, MaxX, MinY and MaxY.
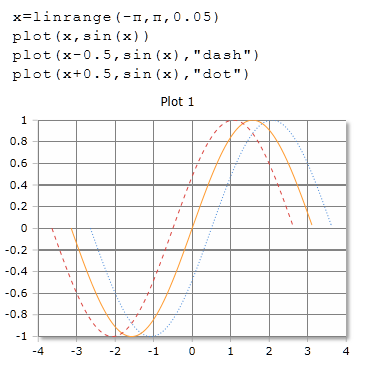
Plot (x, y, "dash")
The line type can be changed to solid , dash and dot .
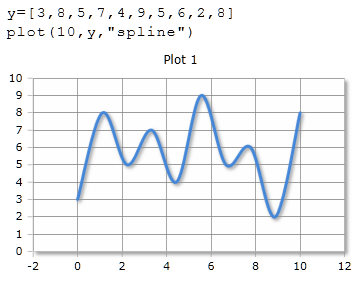
Plot (x, y, "spline")
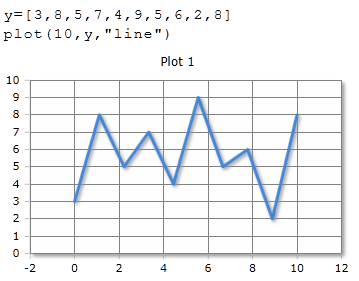
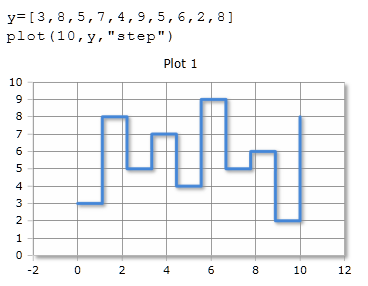
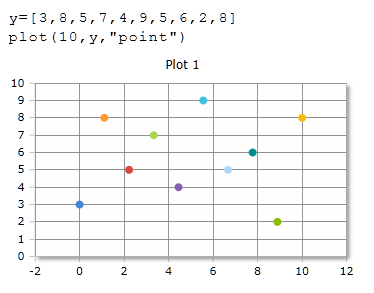
The curve type can be changed to default , line , spline , step and point become.
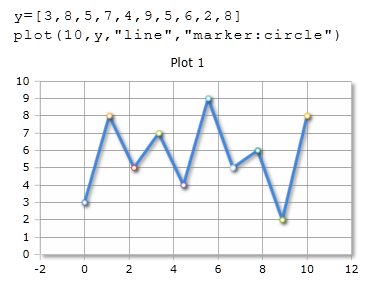
Plot (x, y, "marker:line")
Marker sets marks in the form circle, cross, diamond, line, square , triangle and none . Markers are not displayed on the Type default graph.
Plot (x, y, "marker:5")
A value after the Marker: option changes the size of the marker.
Plot (x, y, "title:Name")
Title changes the text in the legend
Plot (x, y, "thickness:3")
Thickness: changes the width of the line.
Plot (x, y, "color:#rrggbb")
Color:# changes the color of the line. The color is given in 6 hexadecimal numbers for red, green and blue.
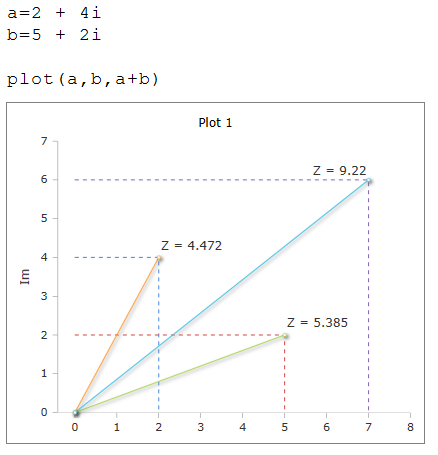
Plot (i, [i, i, ..])
Visual representation of complex numbers.
Examples
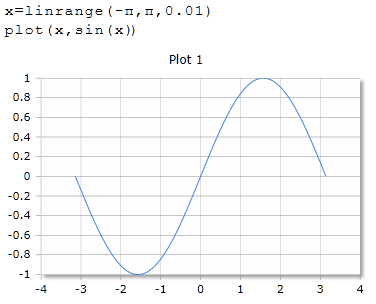
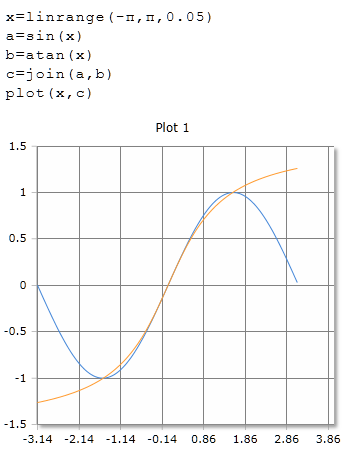
In the example below, X is the basis for the X-axis scale.
To scale the X-axis, a list can be specified as an argument.
The data points are set at the specified X / Y position if the fields of X and Y are the same length.
If the argument is a single value, the scale starts with 0 and ends with the value of the specified argument.
If the argument Y is a table or a matrix, a line is drawn for each row.
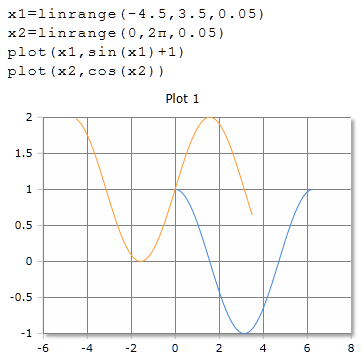
Multiple plots can use the same plot box. The X and Y vectors can have different regions.
Optionally, different line styles can be set. (solid, dash, dot)
Optionally, different plot types can be set
default:
line:
spline:
step:
point:
Optionally, one of the following markers can be set:
circle, cross, diamond, line, square, triangle und none.The marker setting in the plot command has a higher priority than the default setting in the setting panel of the plot box.
The argument "marker: none" disables the markers.
The argument "marker: 12" sets the marker size to 12. the default size is 6.
point:
Visualization of complex numbers
point:
Generator Funktionen